ENGEVITY BESS CO-OPTIMISATION MODEL: A better approach to battery optimisation and investment assessment
THE SHORTCOMINGS OF CURRENT APPROACHS TO BESS MODELLING
The energy sector, generation/storage developers, and increasingly customers are recognising the value that battery storage systems can create.
However, assessing whether a BESS is worthwhile for each application, portfolio and location remains a key challenge for energy generators and users looking to add storage to their portfolio.
Several battery revenue models that we have come across quite understandably rely on a rather crude, ‘percent of perfect’ or ‘capture efficiency, analysis that calculate the ‘best’ price periods annually for charging and discharging and then derate the arbitrage revenue by a percentage to represent the assumed forecasting ‘imprecision’.
The problem is that these calculations cannot track relatively simple but critical factors including whether:
a) the battery has enough charge to dispatch into the highest price periods
b) the battery is not already fully charged during the lowest price periods
c) there is a benefit (or risk) from operating the battery as part of a generation-retail-load portfolio, or from onsite integration via a microgrid, co-located generator or co-located load.
These insights can only come from a simulation of the market driven battery arbitrage operations, alongside the interactions with other generation/load assets in the portfolio.
To realistically capture the battery benefits in each trading interval, it needs to consider operations at a 5 minute resolution to match the dispatch and settlement periods in the NEM (remember that the faster response of batteries is why the NEM moved to 5 minute settlement in the first place).
With 5 minute trading intervals, there are now 105,120 price periods to consider each year, as opposed to 17,520 under the previous 30 minute settlement arrangement.
Modelling to this granularity is necessary for high quality outputs but requires a sophisticated approach to manage this 6-fold increase in data density. The complexity of comprehensive BESS modelling for the modern NEM can easily outstrip the capabilities of standard excel-based models.
ENGEVITY’S BESS MODEL
Over the past few years, Engevity has developed a BESS co-optimisation model to help our clients understand the value, and risks, of an optimised BESS system for any combination of battery, load, retail and generation assets or financial exposures from hedging/contracts.
Already, our model has sized and justified investment cases on over 800MW/1.5GWh of BESS collocated with renewables (wind/solar) and gas plant in 3 NEM regions.
Our model is a comprehensive techno-financial model, 5-minute optimised energy market arbitrage simulation and financial model, allowing for the adjustment of:
· The dynamic spot price trigger logic for BESS charge and discharge
· Co-optimision constraints and opportunities of collocated generation, load or other portfolio assets
· The historical BESS FCAS revenue achieved for similar assets in each NEM region
· The forecast FCAS revenue profile across all eight markets using client, scenario based or using third party forecasts
· The associated network costs and local constraints
· Additional revenue streams such as PPA contracts, network contracts, portfolio relationships etc
With our model, Engevity can:
· Determine lifetime value of a BESS for the client’s application and position in the market
· Optimise BESS power /energy sizing and alternative technology options
· Provide a robust investment case model that can be visualised and easily interrogated on a standard Microsoft ‘Power BI’ dashboard.
· Empower our clients to better understand the actual plant operations and portfolio interactions. So that they recognise the opportunities and risks of their BESS assets
· To test the operation against actual ‘good years’ and ‘bad years’ for BESS revenue in the NEM region to ensure that the investment decision for a battery appreciates the year-on-year volatility and reliance on ‘windfall’ market events to achieve some of the exceptional results seen by the early utility scale BESS assets in the NEM.
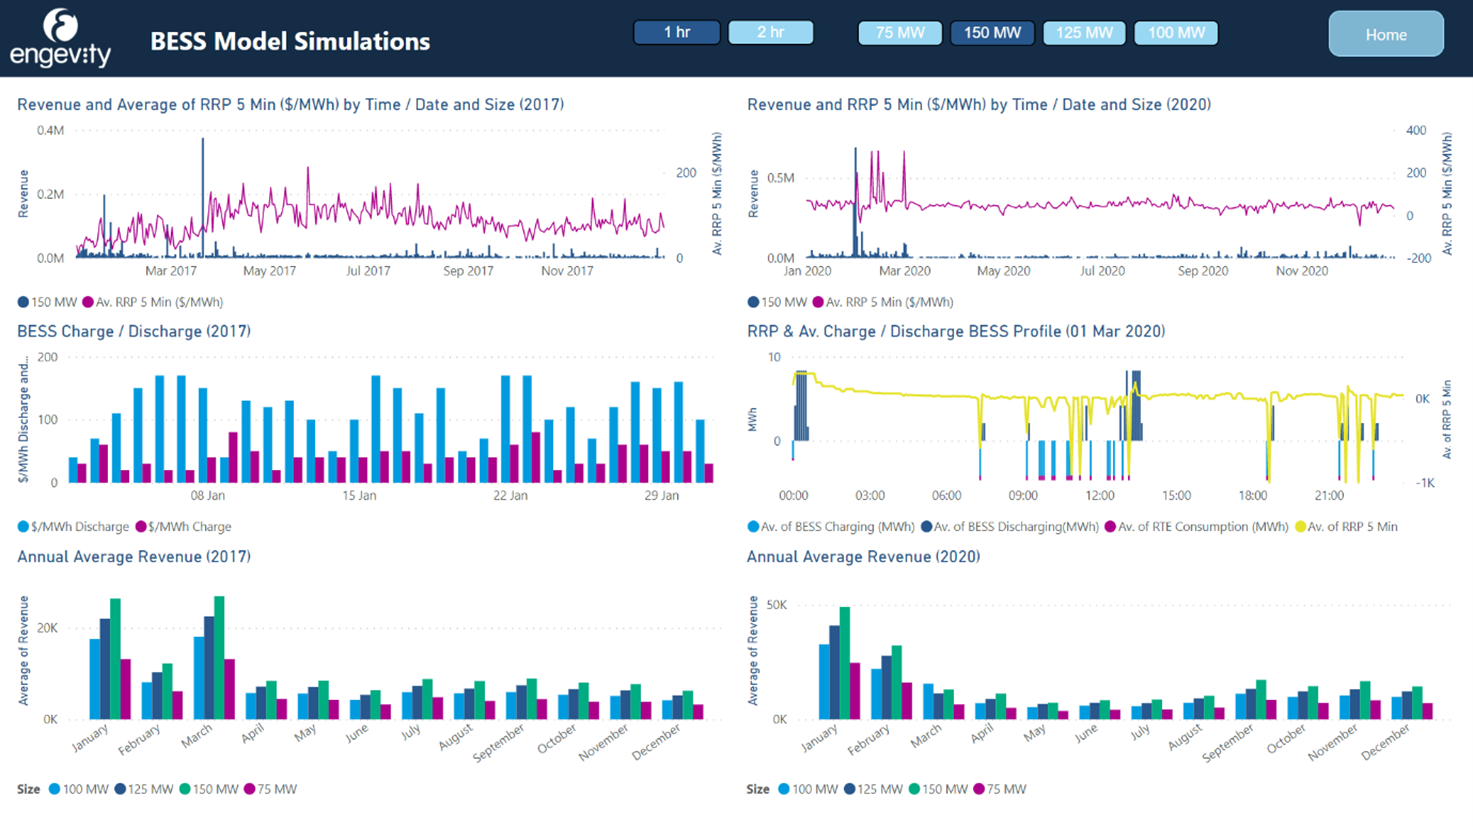
The figure leading this article provides example outcomes of our Power BI ‘result dashboard’ for a fictional battery asset. Included in this example is analysis against 2017 and 2020 basis years (as two years with very different market dynamics in the NEM) and optionality to assess the outcomes of different power and energy sizing options.
We have made available an interactive dashboard of example BESS scenarios online for potential clients to evaluate and better understand the insight we can provide into your BESS project.
To get the link or to discuss further, you can contact us at https://www.engevity.com.au/contact
Engevity Battery Model: Example Dashboard
Author: Craig Chambers